
Usually a 3D/CAD/graphically rich application will be limited by a particular resource. To understand application performance you need to consider factors such as IOPS, RAM, CPU, GPU, vCPU contention and networking.
Typically for most applications, one resource will be exhausted before the others, often this is CPU. For some applications though the GPU framebuffer available maybe the bottleneck, limiting performance. This is most likely to be the case on applications involving large data sets e.g. ESRI ArcGIS, Petrel and CAD applications handling very large parts.
Note at the time of writing it is not possible to measure the vGPU processing load per VM or from within a VM.
Every GPU or vGPU has an allocated frame buffer:
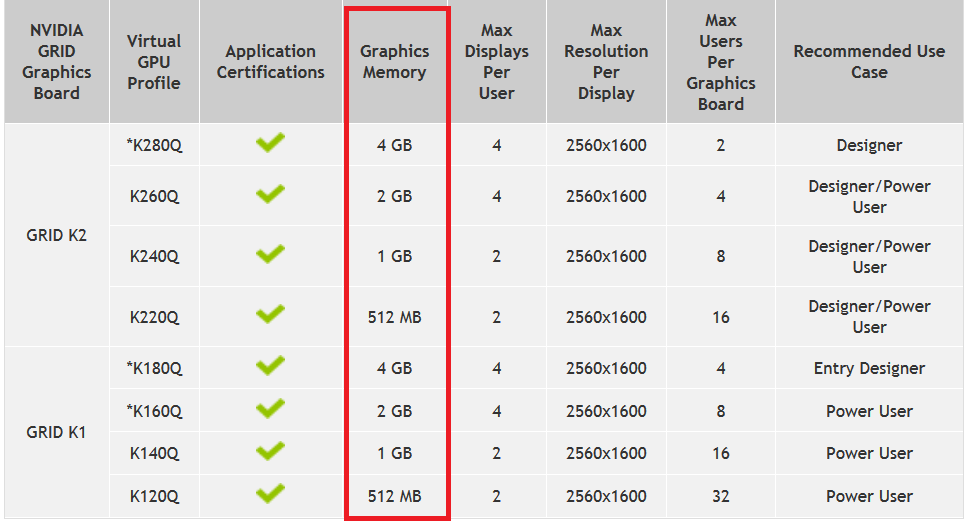
When vGPU was initially launched there were vGPU profiles such as the K100 and K200 with a small 256MB framebuffer, users often noted corruptions when using Unigine Heaven which requires a minimum of 512MB framebuffer. Those artefacts are the same as seen on physical GPUs which have the same framebuffer and should be expected on physical servers as well as virtualised if too small a framebuffer is used. Current advice for new deployments is to use the K120Q / K220Q profiles rather than the K100 / K200 vGPU profiles.
To get an accurate measure of the GPU utilization for a particular deployment, we need to investigate both the host utilization and frame buffer utilization inside a VM. There are multiple tools and methods to achieve this. Some of the free and generally available methods and the steps to use them are:
Monitoring the GPU utilization resources on the host
- Using Nvidia System Management Interface (nvsmi) It is possible to monitor the whole physical GPU via the nvidia-smi utility within the hypervisor. However it should be noted that nvidia-smi only lets you access metrics for the whole physical GPU and if there are multiple VMs sharing the GPU, the results pertain to the whole GPU and not resources used by a particular VM. It is not possible so see which application is using the framebuffer via nvdia-smi, nvidia-smi is querying the silicon not the VM.
How to use it:
a. ssh into the host
b. {root@ESXi1:~] nvidia-smi
2. Citrix XenServer/HDX tools:
Beginning XS6.2 and later, Citrix XenServer supports access to most performance counters from NVML.
a. Launch XenCenter and confirm through console the GPUs are running
b. Click on Performance tab to the total Amount of FrameBuffer used on the physical GPU and how it changes over time as you load/unload more VMs
NOTE: Citrix XenServer has a good deal of metrics which can be accessed from a command prompt in the hypervisor or from within the XenCenter management console. Many metrics are off by default to avoid unnecessary system load where they not normally be needed. There is a very detailed guide on which metrics are available, how to configure thresholds for alerts and how to trigger email alerts within Chapter 9 of The XenServer Administrator Guide. Always consult the version of the guide pertaining to the version of XenServer you are using.
3. ESXi performance counters:
The ESXi command-line query utility lists the GPUs that are installed on the ESXi host and displays the amount of GPU memory that is reserved for each virtual machine on the host
~# gpuvm
Xserver unix:0, GPU maximum memory 2076672KB
pid 118561, VM "JB-w7-64-FC3", reserved 131072KB of GPU memory.
pid 64408, VM "JB-w7-64-FC5", reserved 261120KB of GPU memory.
GPU memory left 1684480KB.
Monitoring the GPU utilization per VM
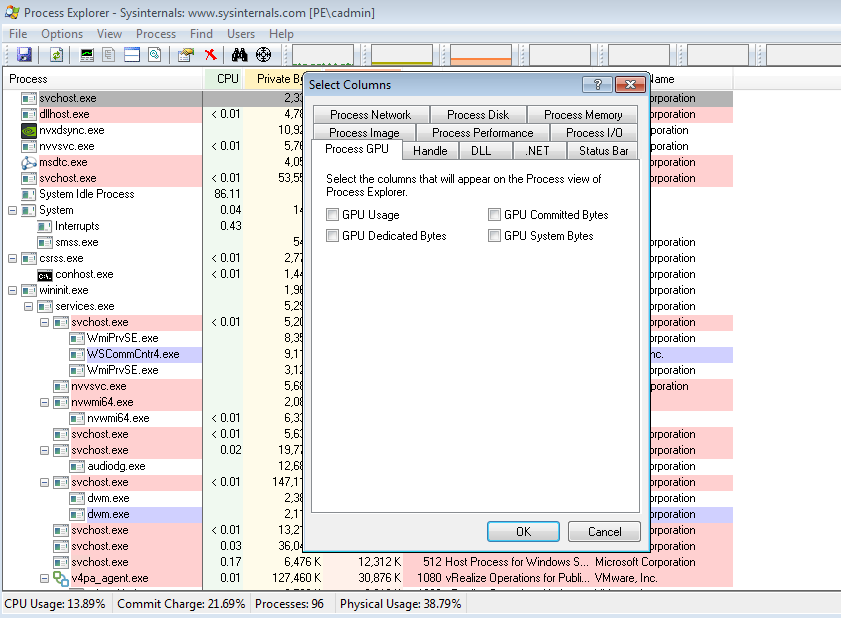
1. Process Explorer: Process Explorer inside the VM gives the most accurate measure of the GPU memory used by the applications. An aggregate of the memory used over the user applications can give a good estimate of the framebuffer sizing for each VM. download it here: https://technet.microsoft.com/en-us/sysinternals/processexplorer.aspx). a. Launch Process Explorer inside the VM. By default it does not show the GPU counters b. Goto View>select columns>Process GPU> select all relevant options
c. Click ok. You should see new columns added detailing GPU committed and dedicated memory. Now, for each process for e.g. acad.exe (AutoCAD), chrome.exe (Google chrome) you can see the exact amount of GPU memory being used. An aggregate of these counters for all the applications running
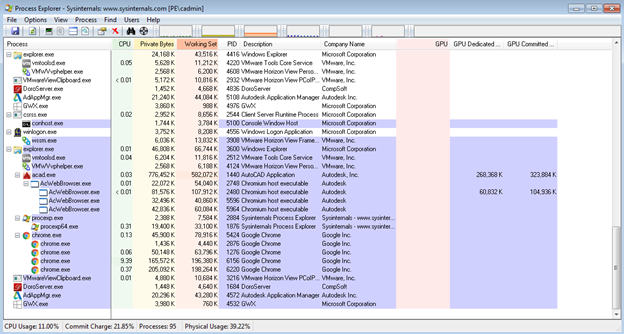
d. Double click on the process to see detailed graphed usage
e. While Process Explorer does not have logging options, It does graph the GPU usage in real time so we can save those screenshots to watch the usage over time.

2. GPU-z:
Is a free to use tool for windows that allows you monitor the GPU. It is, at the time of writing, free to use and can be downloaded here: https://www.techpowerup.com/downloads/
To use it,
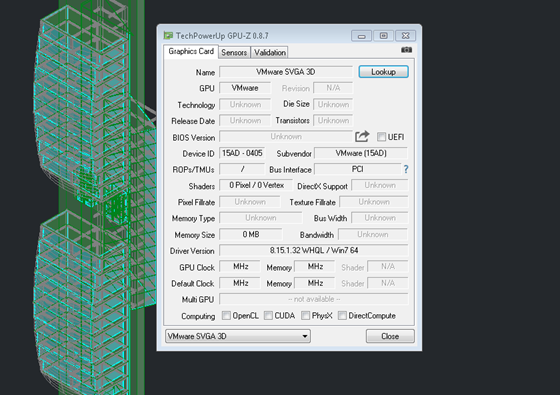
a. Launch GPU. By default it shows on a VM GPUz shows up the VMware/Citrix display adapter info
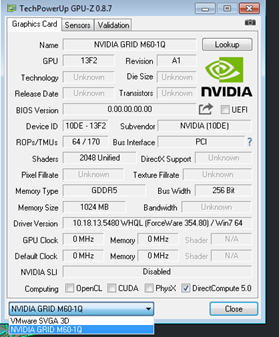
b. Select the correct vGPU profile from the drop down menu at the bottom left corner.
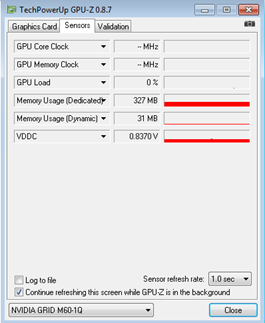
c. This would show the total usage on the GPU for that VM. To dive into more details go to Sensors tab. The memory usage under "Dedicated" and "Dynamic" tells you exact GPU memory used app the running applications inside the VM.
d. For logging options, check the "Log to File" checkbox and select a location. You can then import this text file in others tools of choice. The outputs looks like this:
Date , GPU Core Clock [MHz] , GPU Memory Clock [MHz] , GPU Load [%] , Memory Usage (Dedicated) [MB] , Memory Usage (Dynamic) [MB] , VDDC [V] ,
2016-04-15 12:29:54 , - , - , 0 , 332 , 35 , 0.8370 ,
2016-04-15 12:29:55 , - , - , 0 , 332 , 35 , 0.8370 ,
2016-04-15 12:29:56 , - , - , 0 , 332 , 35 , 0.8370 ,
2016-04-15 12:29:58 , - , - , 0 , 332 , 35 , 0.8370 ,
Video Guide
NVIDIA Engineering have released a quick Video Guide: https://www.youtube.com/watch?v=nD6B3zB1DPo&feature=youtu.be
Other Information
· NVIDIA Engineer Video on monitoring framebuffer: https://www.youtube.com/watch?v=nD6B3zB1DPo&feature=youtu.be
· CPU-Z can be useful particularly for evaluating CPU usage in a similar manner
· Citrix blogs on tools to tune XenServer performance https://www.citrix.com/blogs/2013/12/15/ten-useful-tools-for-optimising-xenserver/
· Third-party blog on monitoring framebuffer for NVIDIA GRID: https://virtuallyvisual.wordpress.com/2015/09/09/monitoring-nvidia-gpu-usage-of-the-framebuffer-for-vgpu-and-gpu-passthrough/
Disclaimer
This article mentions use of third-party tools. All third-party tools are not officially endorsed by NVIDIA and should be used at the user's discretion.